Pyrocast
CONAF’s wildfire weather and satellite monitoring app, used by fire analysts throughout Chile and abroad.
- CONAF
- Lead developer, full stack
- 2024–2026
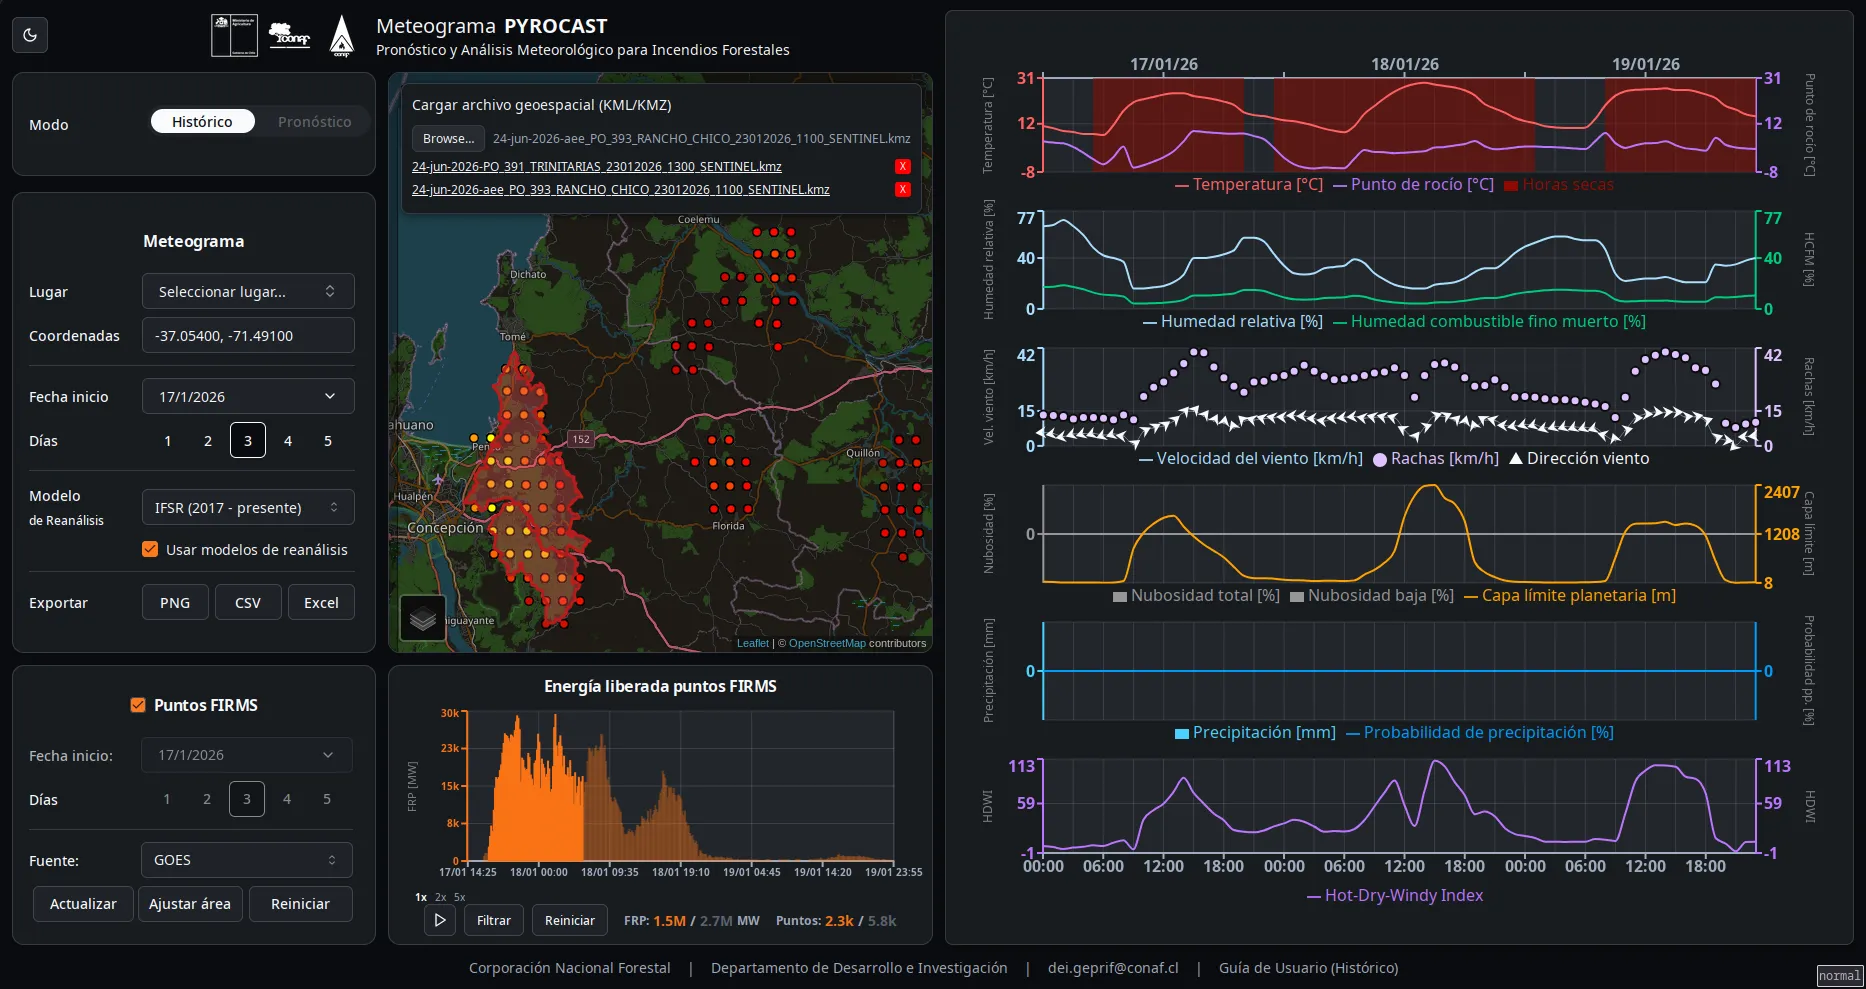
Pyrocast is the tool CONAF’s wildfire teams open to check fire weather and satellite detections for any point in Chile. It grew out of a small single-file prototype, which I rebuilt from scratch in about two months. I kept developing it until 2026, often in response to what analysts needed during an active emergency.
What it does
- Fire weather for any point. Click the map, pick a preset location, or paste coordinates in decimal degrees, degrees and minutes, or degrees, minutes and seconds; the parser even forgives the stray symbols of copied text. Five synchronised charts then show temperature, humidity, fine fuel moisture, wind, cloud cover, boundary layer height, precipitation and the Hot-Dry-Windy index, in the user’s local time, from the weather model of their choice. Tooltips move together across all five charts, and every series can be toggled from its legend.
- Forecast or history. One switch moves between the forecast and any past date, and the controls never allow an inconsistent request.
- Satellite fire detections. NASA FIRMS data from VIIRS, MODIS and GOES on the same map, drawn through a custom canvas layer so thousands of points stay responsive. Marker shape shows the instrument, and a box drawn on the map limits the area requested.
- Fire behaviour over time. Built during a major fire emergency: a fire radiative power chart of every point on the map, with selection, filtering, running totals and animated playback at adjustable speed. It shows how a fire spread, and can even help trace where it started.
- Your own layers. KML, KMZ and shapefiles load directly in the browser.
Colour that carries two variables
Detections are coloured in a two-dimensional space: lightness encodes time since detection, hue encodes fire radiative power. At a glance an analyst can read where a fire is advancing, where it is most intense and where it has died down. Time is measured from the moment being viewed, not from now, so the scheme replays past fires just as well. The newest detections are always drawn on top, and the tooltip places the hovered point on the colour space. The globe on this site’s home page uses the same scheme.
A proxy for the FIRMS API
FIRMS limits how many days one request can cover, and the limit differs by instrument. A small Express service splits long requests and merges the results, fetches several instruments in one call, returns GOES-19 fire radiative power, shifts days to the user’s time zone and answers in CSV or GeoJSON. The app never has to know about those limits, and the API key never reaches the browser.
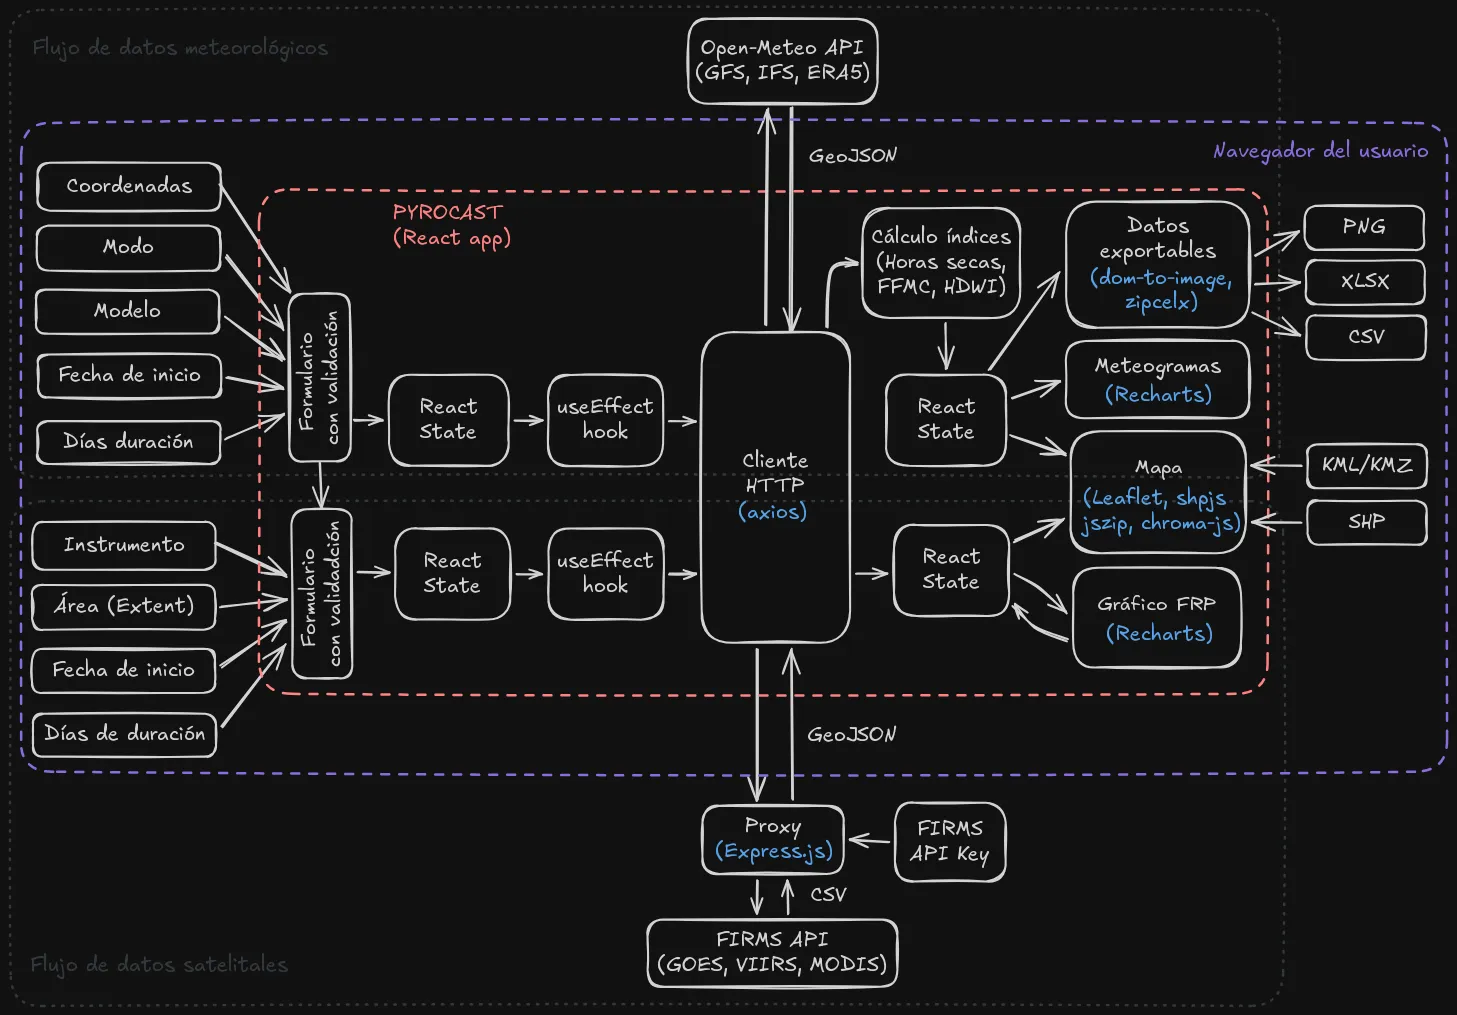
Data flow, as documented for the team (labels in Spanish).
Results
- Part of the routine and emergency work of CONAF offices throughout the country, with up to 6,000 requests a month.
- Used abroad as well: when the Netherlands Institute for Public Safety (NIPV) wrote about its wildfire analysts (in Dutch), its lead photo showed them in a briefing with Pyrocast on the screen.
- Esri Chile’s solutions engineering team got in touch to learn how it was built and how it stays so fast, particularly when loading KML, KMZ and shapefiles in Leaflet.