MeteoDMC
Monthly climate anomalies for Chile’s weather stations, built automatically from the national weather service’s records to show where the fire season is running hotter or drier than normal.
- CONAF
- Lead developer
- 2024
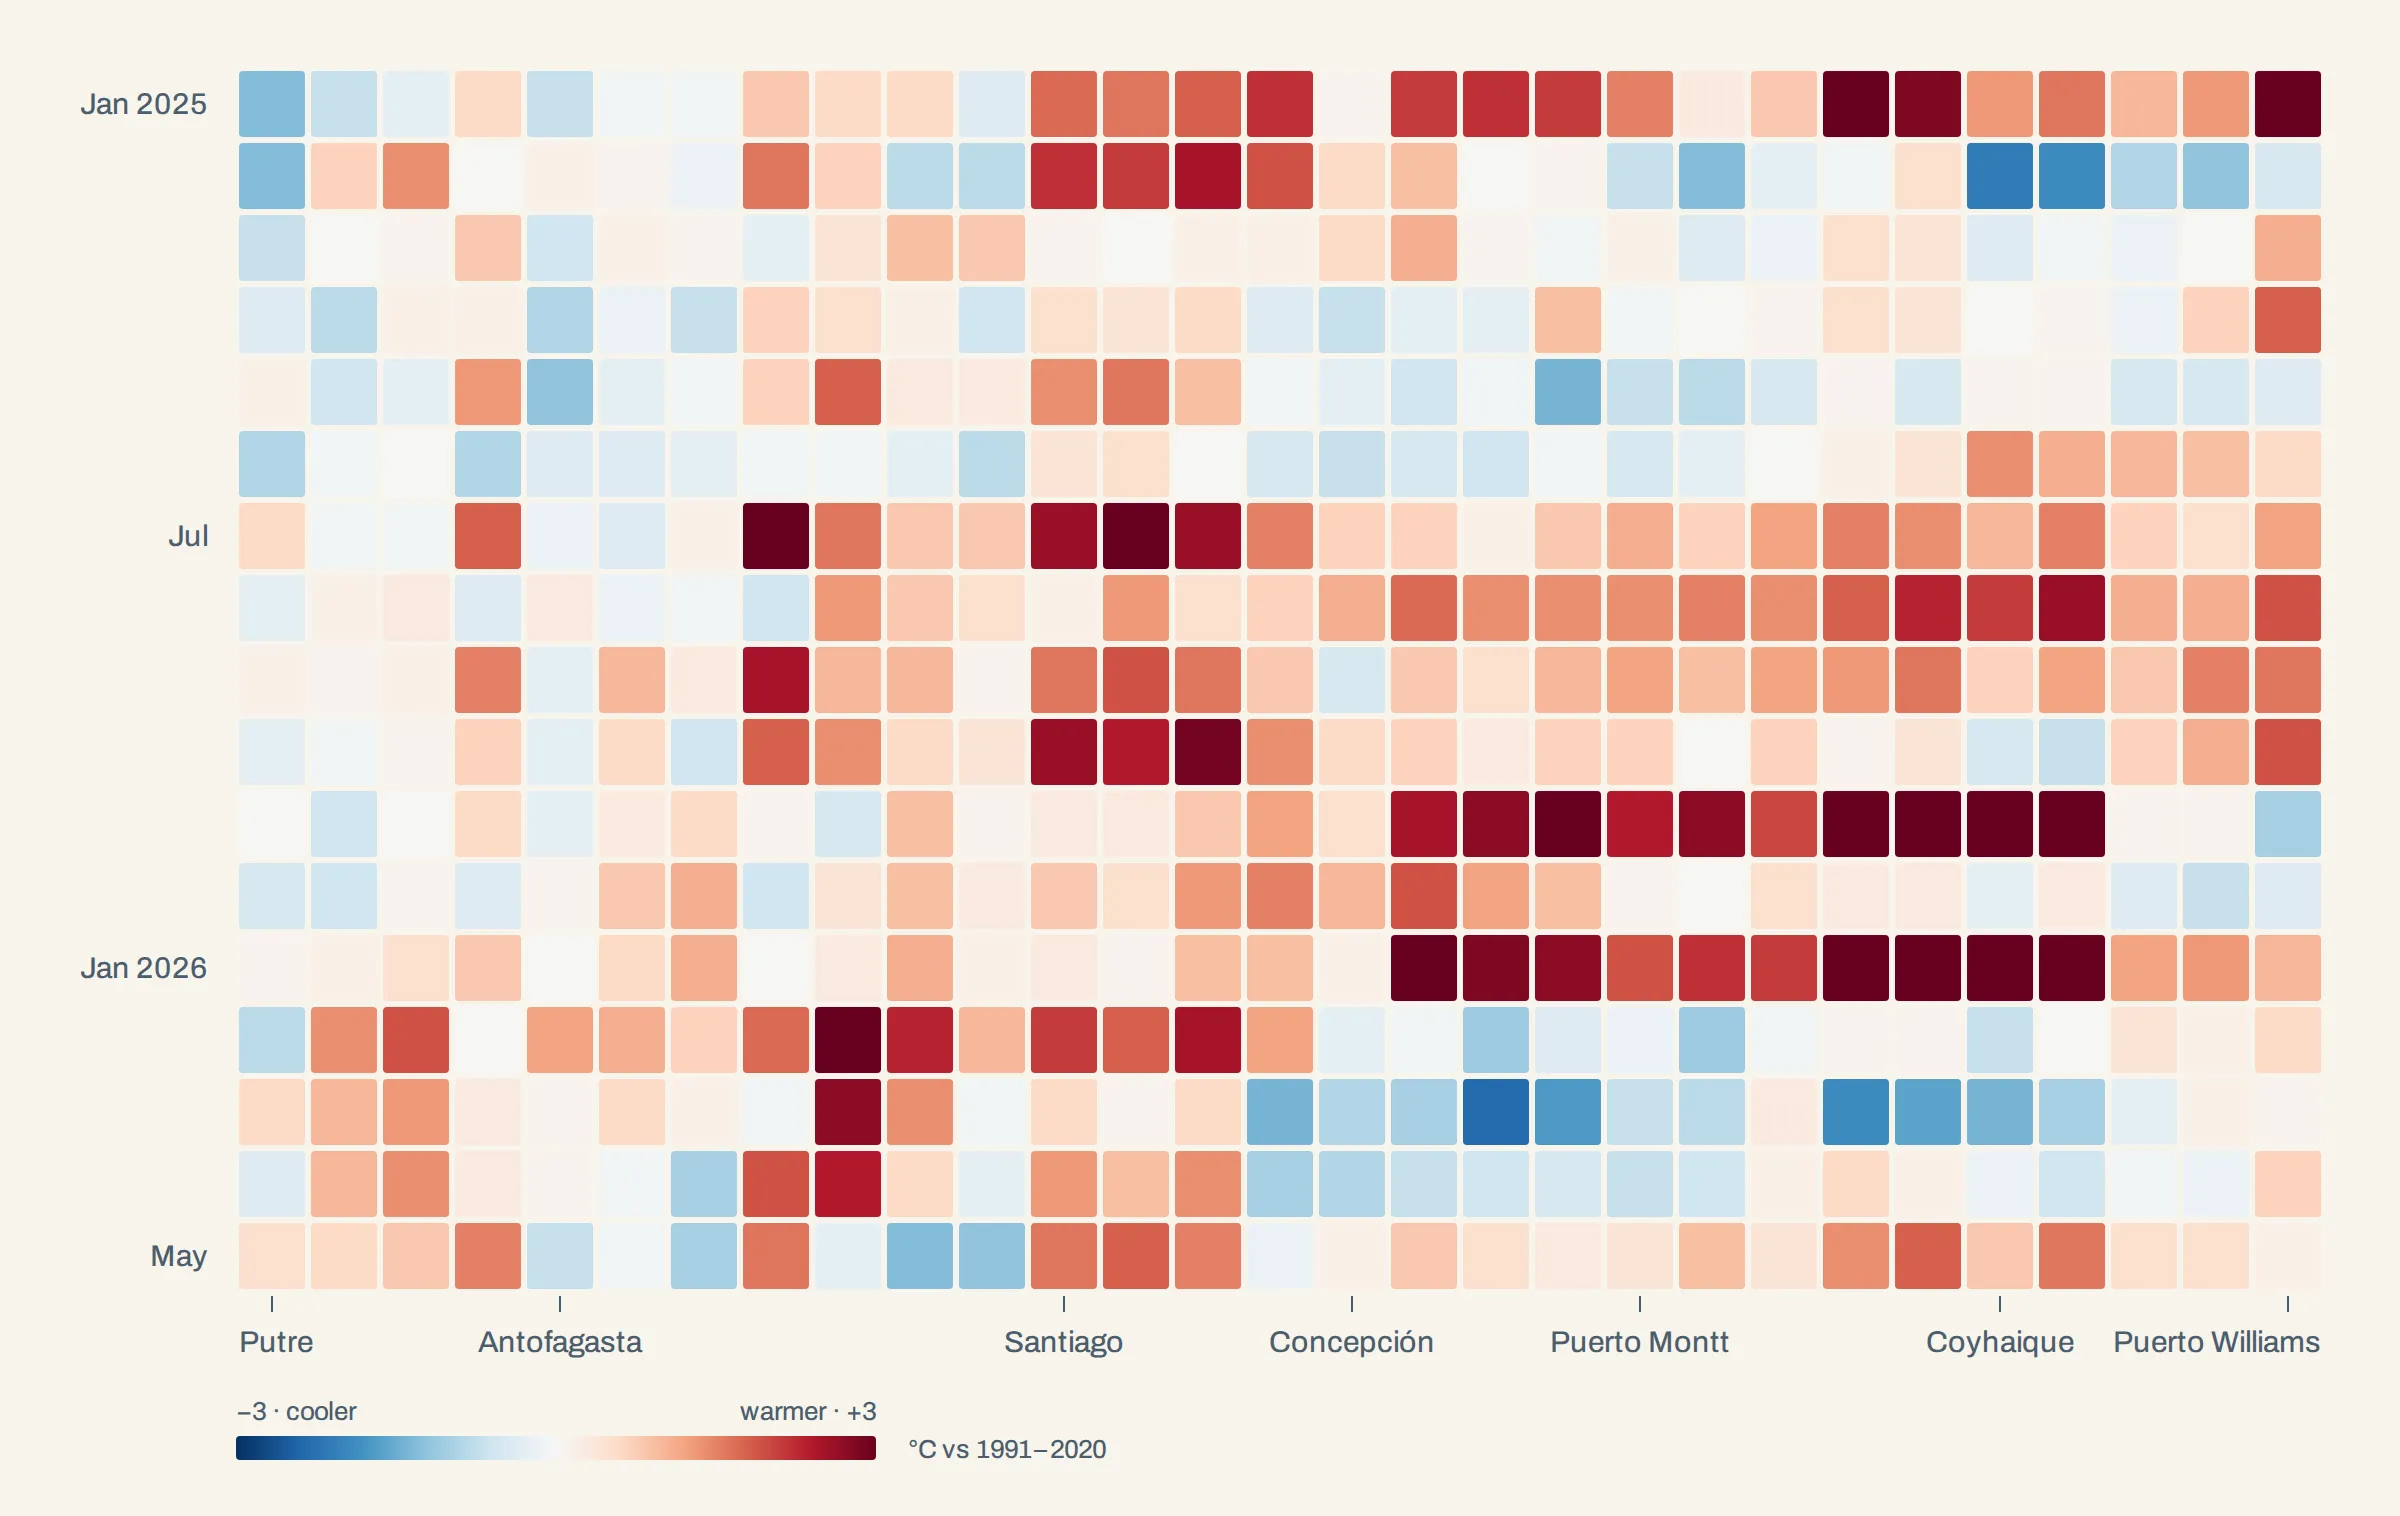
Before and during the fire season, CONAF needs to know where the country is running hotter or drier than usual. The Dirección Meteorológica de Chile (DMC) publishes the records of its stations, but one station at a time, in tables and downloadable files that had to be compiled by hand. MeteoDMC turns them into ready-to-use figures with a single command. I built it in 2024, by hand, without AI coding assistance.
What it does
- Collects the records. Downloads monthly and daily data for about 30 stations, from Putre to Puerto Williams, from the DMC’s climate data service: compressed CSV files, HTML tables and its station catalogue.
- Compares them with the normal. Each month is set against the station’s 1991–2020 normal: in degrees for maximum and minimum temperature, as a percentage for precipitation. Where the DMC publishes no normal, a reference table fills the gap, and stations still missing one are listed in a report instead of silently dropped.
- Draws the figures. Anomaly heatmaps over the last year and a half, on a diverging scale centred on the normal, and the rain accumulated since the start of the fire season compared with the previous season and the climatology.
- Exports the numbers. Every figure comes with Excel tables of the data behind it.
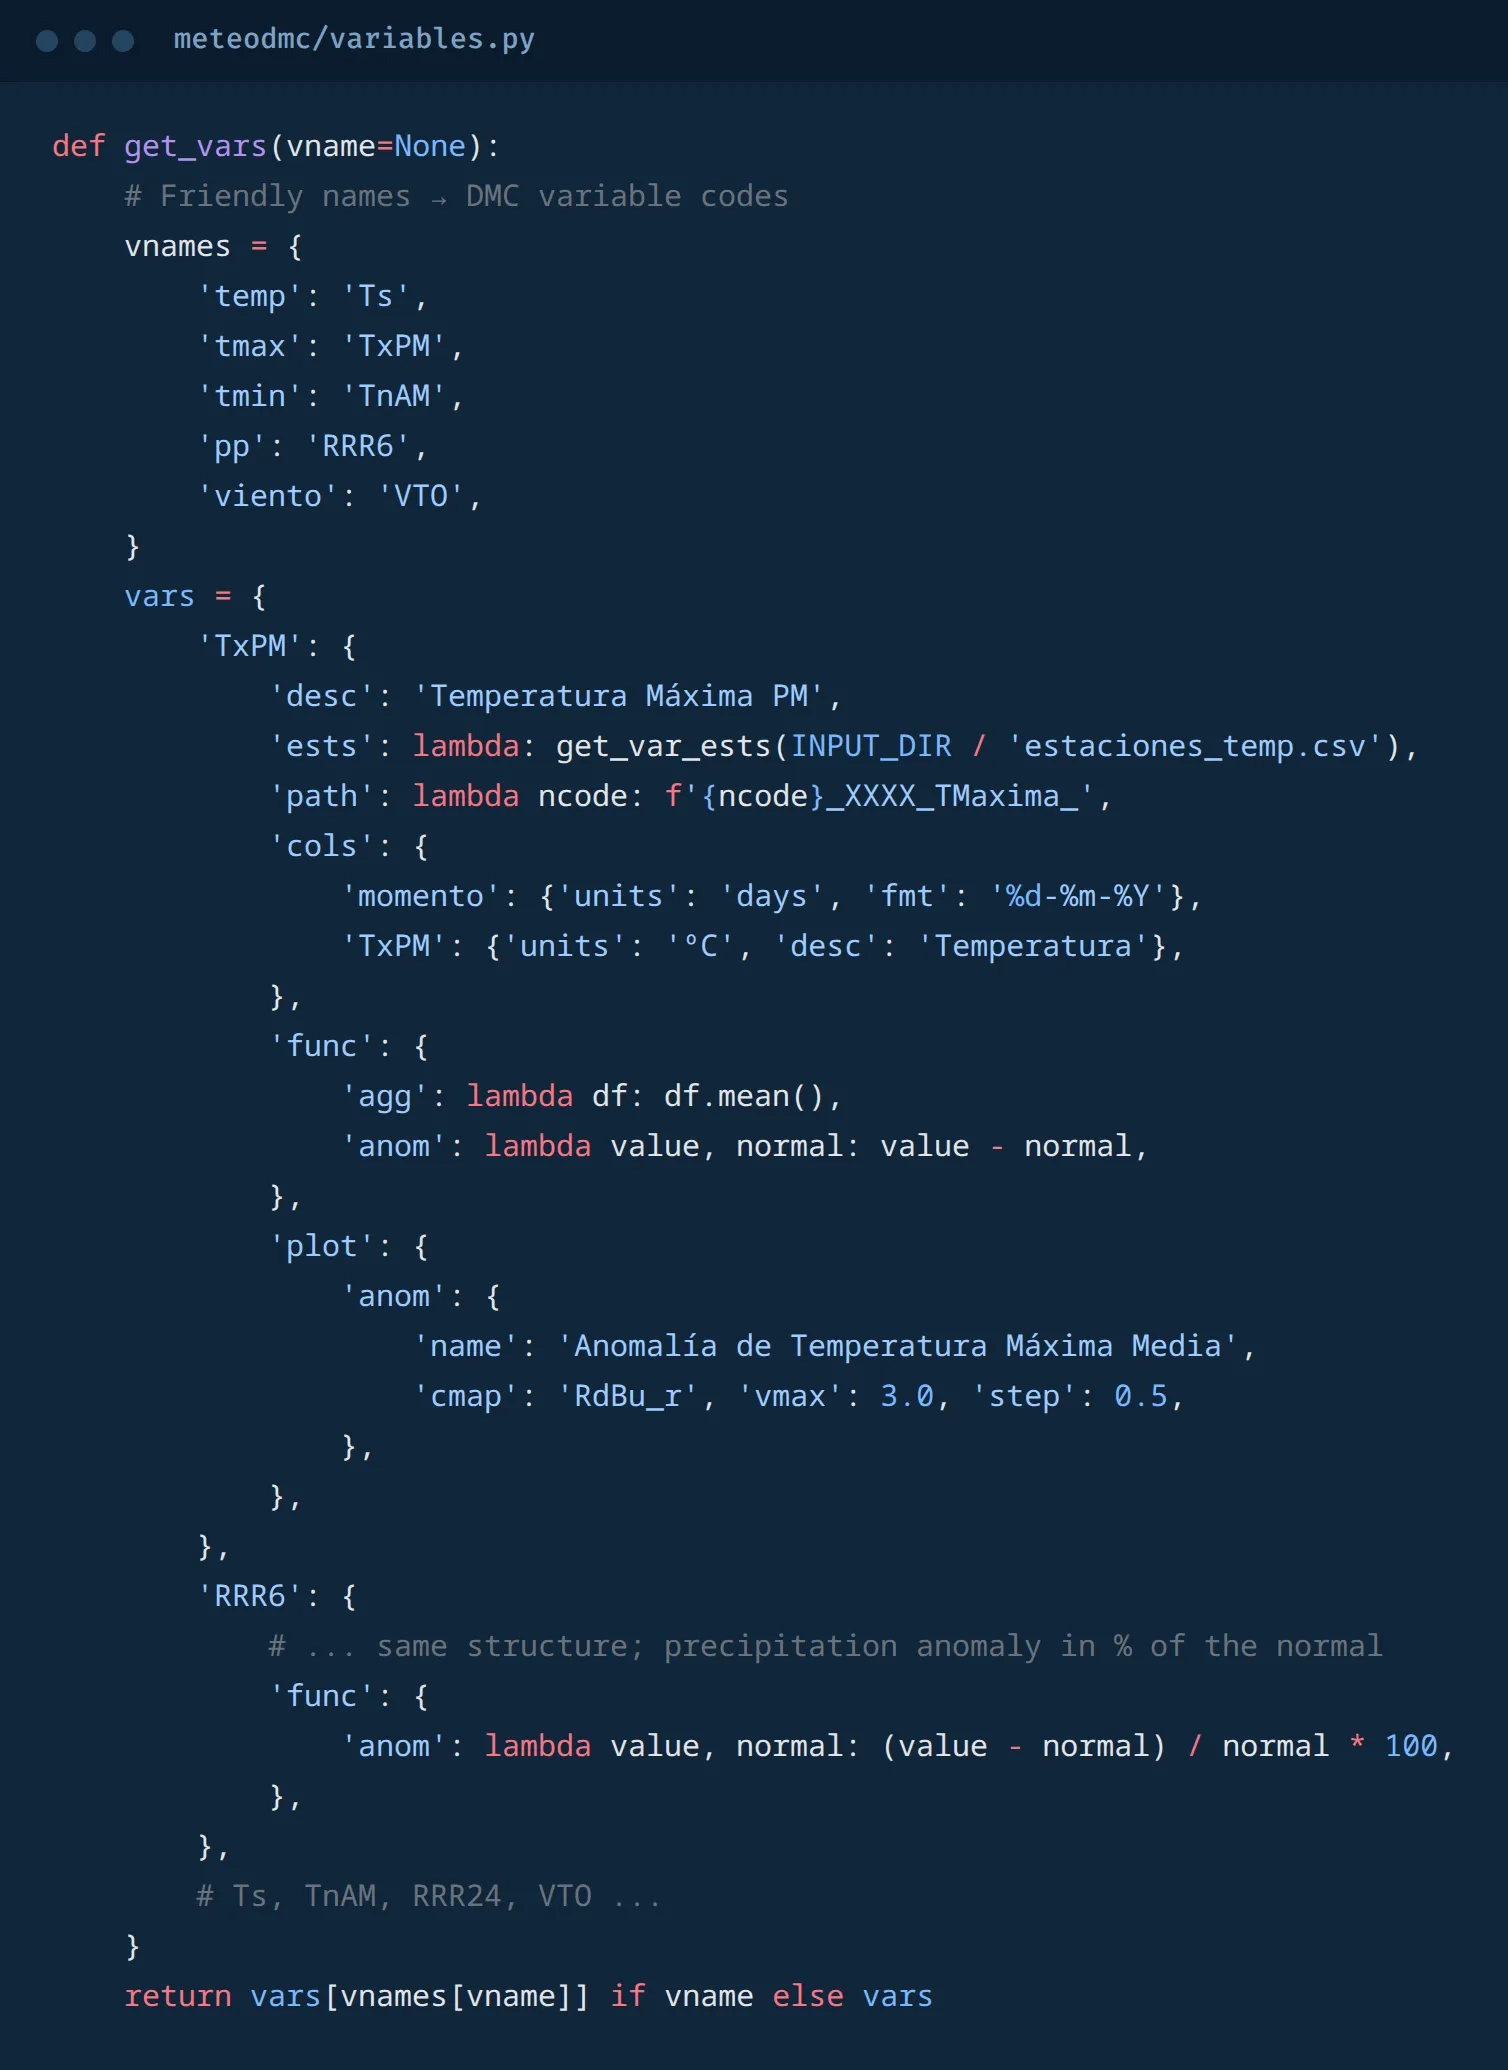
How MeteoDMC describes each DMC variable (excerpt, simplified). Where its files are, how to read them, how to compute the anomaly and how to draw it all live in one definition per variable.
How it is built
A small Python package with one command per product, managed with uv. Collecting, data handling and plotting are separate modules, and each variable defines its own anomaly formula, colour scale and labels, so adding one doesn’t touch the rest.